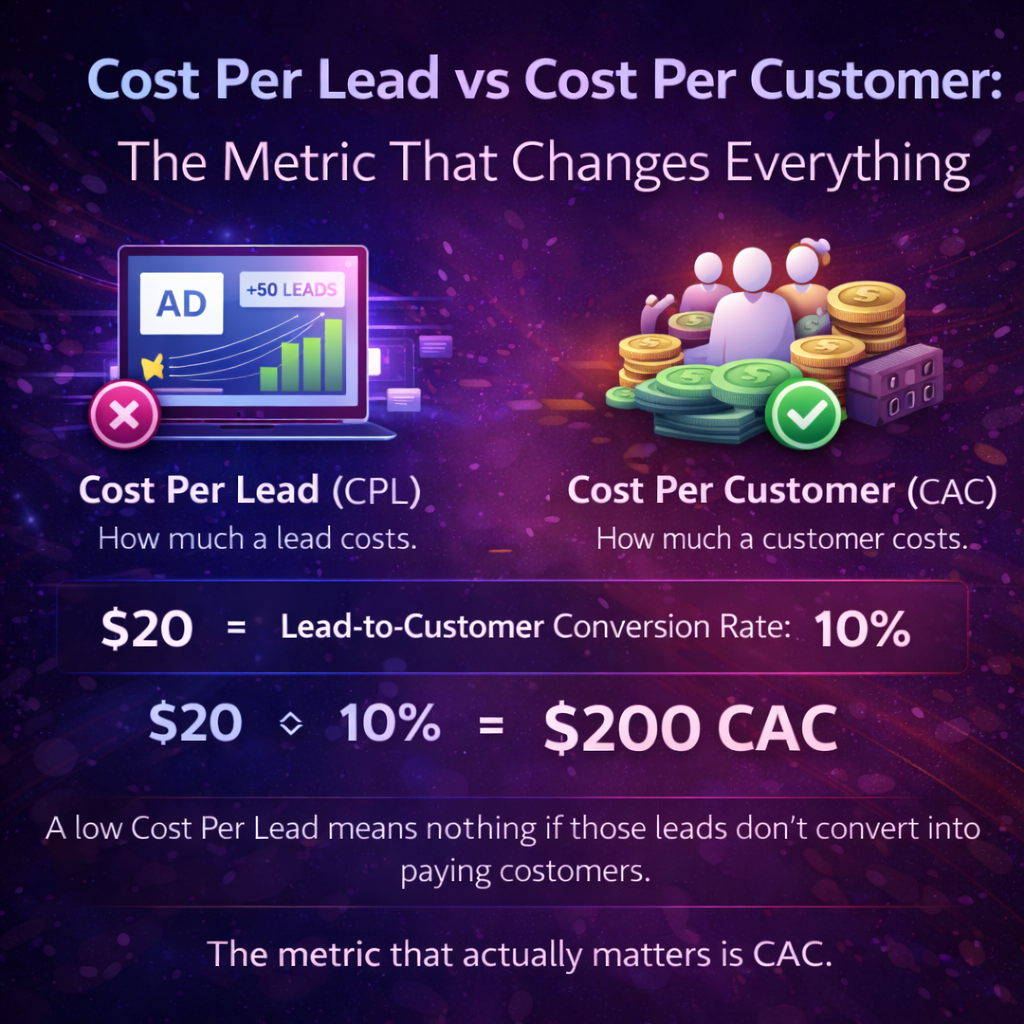

Most businesses optimize for the wrong metric. Learn why Cost Per Lead is often misleading, how it relates to Cost Per Customer (CAC), and what to actually measure to drive profitable growth from paid advertising.
TLDR:
A low Cost Per Lead means nothing if those leads don’t convert into paying customers. The metric that actually drives profitable growth is Cost Per Customer (CAC), calculated by combining CPL with your lead-to-customer conversion rate. Optimizing CPL without understanding CAC leads to budget waste, poor campaign decisions, and revenue stagnation. This article explains the math, the mistakes, and the framework to fix it.
Most businesses running paid advertising are measuring the wrong thing. They optimize campaigns for a lower Cost Per Lead, celebrate when CPL drops, and then wonder why revenue isn’t growing. The problem is not their ads. It’s the metric they’re using to judge them.
Cost Per Lead is a useful early signal. Cost Per Customer is the metric that actually determines whether your marketing is profitable. Understanding the difference between the two, and knowing when each one matters, is what separates businesses that scale efficiently from those that burn budget and stall.
What Is Cost Per Lead (CPL)?
Cost Per Lead is the amount of advertising spend required to generate one lead. A lead is any individual who has taken an action that signals potential interest in your product or service, typically by submitting a form, calling your business, signing up for a trial, or engaging with a specific offer.
The formula is straightforward:
CPL = Total Ad Spend / Number of Leads Generated
If you spend $5,000 on a campaign and generate 200 leads, your CPL is $25. Clean, simple, easy to report. Which is exactly why so many businesses stop there.
CPL is a top-of-funnel metric. It tells you how efficiently your campaigns are generating interest. It tells you nothing about what happens after that interest is captured.
What Is Cost Per Customer (CAC)?
Cost Per Customer, most commonly referred to as Customer Acquisition Cost or CAC, is the total amount of spend required to convert one lead into a paying customer. It incorporates everything CPL ignores: sales friction, offer quality, funnel conversion rates, and lead intent.
The formula:
CAC = Total Ad Spend / Number of New Customers Acquired
Alternatively, once you know your CPL:
CAC = CPL / Lead-to-Customer Conversion Rate
If your CPL is $25 and 5% of leads become customers, your CAC is $500. That’s the number that needs to be weighed against your average customer value, not the $25.
CAC is a bottom-of-funnel metric. It reflects the true cost of business growth and is the number that determines whether your marketing is an investment or an expense.
Why CPL Is Misleading in Most Real-World Scenarios
The danger with CPL is not that it’s wrong. It’s that it’s incomplete. And incomplete data used to make complete decisions is worse than having no data at all.
Here is where CPL breaks down in practice.
Lead Quality Is Not Captured in the Number
Two campaigns can both deliver a $30 CPL. One generates leads from high-intent search queries like “hire a tax accountant near me.” The other generates leads from a broad Facebook audience responding to a free checklist offer. These leads are not comparable, but their CPL is identical.
The search leads might convert at 20%. The Facebook leads might convert at 2%. The resulting CAC is $150 versus $1,500. Same CPL. Completely different economics.
Optimizing purely for CPL in this scenario would push budget toward Facebook (if the creative is cheaper to run at scale), which would quietly destroy your acquisition efficiency while your CPL dashboard shows a green number.
CPL Hides Funnel Failure
A low CPL paired with a poor conversion rate is a sign of funnel failure, not campaign success. The problem could be anywhere: a misaligned offer, a slow sales follow-up process, weak landing page copy, or a disconnect between what the ad promises and what the prospect receives.
When businesses see a low CPL, they often assume the campaign is performing and look for problems in other places. This delays the diagnosis and extends the budget bleed.
Channel Mix Distorts CPL Benchmarks
Paid search, paid social, programmatic, and influencer campaigns all operate at different CPL ranges for structural reasons, not because one is inherently better. CPL benchmarks from one channel cannot be applied to another without accounting for intent level, audience stage, and conversion behavior.
A $120 CPL from Google Search with a 25% conversion rate produces a $480 CAC. A $15 CPL from TikTok ads with a 1% conversion rate produces a $1,500 CAC. The cheaper lead is four times more expensive in the metric that actually matters.
The Mathematical Relationship Between CPL, Conversion Rate, and CAC
This is the core equation every performance marketer should have memorized:
CAC = CPL / Conversion Rate
It reveals a powerful truth: your CAC is controlled by two levers, not one. You can lower CAC by reducing CPL. You can also lower CAC by increasing your lead-to-customer conversion rate, without touching CPL at all.
Let’s run the numbers on three scenarios:
Scenario A: CPL = $40, Conversion Rate = 5%, CAC = $800 Scenario B: CPL = $60, Conversion Rate = 15%, CAC = $400 Scenario C: CPL = $40, Conversion Rate = 15%, CAC = $267
In Scenario B, the CPL is 50% higher than in Scenario A, but the CAC is half the cost. Anyone optimizing for CPL alone would defund Scenario B in favor of Scenario A, and their acquisition efficiency would collapse.
Scenario C shows the ideal outcome: lower CPL combined with high conversion. This is achieved by improving both the targeting quality and the post-click funnel simultaneously.
Real-World Business Scenarios Where Good CPL Produces Bad Revenue Outcomes
The High-Volume, Low-Value Lead Trap
A home services company runs Facebook lead generation ads and achieves a $12 CPL. The campaign generates 800 leads per month. Leadership is excited. The sales team is overwhelmed.
Of those 800 leads, 600 are unresponsive or unqualified. 150 are mildly interested but not ready to buy. 50 convert. The CAC is $192. The average job value is $180. They are spending more to acquire a customer than that customer is worth.
The CPL looked like a win. The CAC revealed a fundamental business model problem hiding behind it.
The “Too Cheap” Lead Quality Problem
A B2B SaaS company runs a content download campaign and generates leads at $8 each. The content is a free guide with no qualification gate. Their sales team spends three weeks working the list. Conversion rate: 0.8%.
CAC from this campaign: $1,000. The product’s average contract value is $2,400 annually. After accounting for churn and cost of service, they barely break even on customer acquisition.
A competing campaign uses a webinar format with a 20-minute time investment as the conversion action. CPL is $65. Conversion rate: 12%. CAC: $542. Profitability is nearly double, despite a CPL that is eight times higher.
The Agency That Reported CPL and Ignored CAC
This scenario plays out constantly in agency-client relationships. The agency reports a month-over-month CPL improvement of 35%. CPL drops from $80 to $52. The client is pleased.
What the report doesn’t show: lead-to-customer conversion dropped from 18% to 7% over the same period. The old CAC was $444. The new CAC is $743. The client’s revenue growth slowed. The ad spend increased. And the agency’s performance dashboard showed green.
This is not hypothetical. It is a structural flaw in how most agencies measure and report results, and it is exactly the kind of problem that a performance-focused partner should be built to prevent.
A Decision-Making Framework for Business Owners
Before making any campaign decision based on metrics, run it through this four-question framework:
1. What conversion rate is this CPL based on? Never evaluate CPL in isolation. Always ask: “What percentage of these leads become customers?” If you don’t know, you don’t have enough information to make a good decision.
2. What is the resulting CAC, and how does it compare to LTV? If your LTV:CAC ratio is below 2:1, you have an acquisition economics problem regardless of what your CPL looks like. The threshold for a healthy business is typically 3:1 or better.
3. Is the CPL being driven down by volume or by quality? A CPL decrease driven by better targeting and creative is a genuine improvement. A CPL decrease driven by relaxing qualification criteria is a trap that will surface as a CAC spike in 30 to 60 days.
4. Where in the funnel is the conversion failure? If CAC is high, the root cause could be the ad (wrong audience), the landing page (wrong message), the offer (wrong incentive), or the sales process (wrong follow-up). Each has a different fix, and confusing them leads to wasted optimization effort.
When CPL Is Useful and When It Is Dangerous
CPL is a valid and useful metric in specific contexts:
- Early-stage channel testing: When you are running small-budget tests across multiple platforms to identify where your audience lives, CPL gives you a fast, comparable signal before you have enough conversion data.
- Creative performance comparison: When two ads run to the same audience with the same offer, CPL differences reflect creative efficiency. This is a legitimate use of the metric.
- Top-of-funnel benchmarking: For brand awareness campaigns where direct conversion is not the goal, CPL helps quantify interest generation cost.
CPL becomes dangerous when:
- It is used as the primary KPI for budget allocation decisions
- It is reported without corresponding conversion rate and CAC data
- It is used to compare campaigns across different funnel stages or intent levels
- It creates incentives to reduce lead quality in order to hit volume targets
The rule of thumb is simple: CPL answers “how efficiently are we generating interest?” CAC answers “how efficiently are we generating revenue?” Revenue is the objective. Never lose sight of which metric actually maps to it.
Practical Optimization Strategies That Actually Move CAC
On the Campaign Side
Tighten audience targeting based on closed customer data. Run your existing customer list through audience intelligence tools and build lookalikes from buyers, not just leads. A 15% CPL increase from a smaller, more precise audience often results in a 40% CAC improvement.
Separate intent levels in campaign structure. Run different campaigns for cold audiences (awareness), warm retargeting (consideration), and high-intent search (decision). Each stage has a different acceptable CPL benchmark, and conflating them distorts every metric downstream.
Use lead scoring or qualification gates before counting a conversion. A multi-step form, a qualifying question, or a time-investment offer (like a webinar or consultation) pre-qualifies leads and raises CPL while dramatically improving the lead-to-customer rate.
On the Funnel Side
Speed of follow-up is a conversion rate multiplier. Research consistently shows that lead response time within five minutes versus five hours can increase conversion rates by 20x or more. If your CAC is high, audit your lead response process before touching the ads.
Audit landing page message match. The specific claim in your ad must be mirrored precisely on your landing page. Any mismatch between what was promised and what is presented increases bounce rate and kills conversion. This is one of the highest-leverage, lowest-cost fixes available.
Map your post-lead nurture sequence to buying stage. A lead from a free content offer is not ready for a sales call. A lead from a “get a quote” form is. Sending every lead through the same sequence is a common cause of a low overall conversion rate that makes CAC look broken when the ads are actually performing fine.
On the Reporting Side
Require integrated reporting that connects ad spend to revenue outcomes. If your marketing reports stop at CPL or even at lead volume, you are flying blind. The minimum viable reporting stack tracks spend, leads, CPL, qualified leads, customers, CAC, and LTV by channel and campaign.
Set CAC targets before campaigns launch, not after. Know your LTV, decide your acceptable LTV:CAC ratio, back-calculate the maximum CAC you can afford, then set CPL targets based on your realistic conversion rate expectations. This inverts the typical approach and produces far better budget decisions.
The Most Common Mistakes Marketers and Business Owners Make
Celebrating a CPL decrease without verifying conversion rate held steady. CPL and conversion rate move in opposite directions when you make certain changes, like broadening your audience to reduce CPL. The combined effect can be a higher CAC despite better-looking top-of-funnel numbers.
Blaming the ads when the problem is the funnel. Paid traffic delivers prospects. Your funnel converts them. If CPL is reasonable but CAC is high, the campaign may be doing its job while the funnel fails. Many businesses scale their ad spend trying to overcome a conversion problem, and this compounds the loss.
Comparing CPL across industries or business models. A $200 CPL for a high-ticket B2B service with a $50,000 contract value is an excellent result. The same CPL for a $500 e-commerce product would be catastrophic. CPL only has meaning in the context of your specific unit economics.
Letting agencies optimize for what’s easy to measure. CPL is easy to measure and easy to improve in ways that look good on a dashboard. CAC requires integrated data across marketing and sales, which requires more sophisticated infrastructure and reporting honesty. Agencies that only report CPL are optimizing for optics, not outcomes.
Ignoring LTV as the ceiling on CAC. Customer Lifetime Value is not a vanity metric. It is the upper boundary of how much you can rationally spend to acquire a customer. Businesses that don’t know their LTV cannot set rational CAC targets, which means every budget decision is made without a reference point.
The Strategic Shift That Changes Campaign Performance
The businesses that scale paid advertising profitably all make the same mental shift at some point: they stop asking “how do we get cheaper leads?” and start asking “how do we get leads that cost more to acquire but generate more revenue?”
This shift changes everything downstream. It changes which campaigns you run, which audiences you target, which offers you test, how you structure your sales process, and how you evaluate your results.
At S² Ads Agency, this is the framework applied to every client account from day one. Performance campaigns are built around CAC targets derived from actual LTV data, not arbitrary CPL benchmarks. Reporting connects ad spend directly to revenue outcomes, not just lead volume. For businesses that are serious about scaling profitably, this is what working with a premium partner actually looks like. Engagements start from $1,500 per month with the Startup Plan, designed for businesses ready to build on a proper performance foundation from the start.
The metric you optimize for determines the business you build. Optimize for CPL and you get a lead-generation machine with uncertain revenue attached. Optimize for CAC against a known LTV, and every dollar of ad spend has a calculable return expectation and a clear benchmark for success.
The Metric That Actually Changes Everything
Cost Per Lead is not a bad metric. It is an incomplete one. Used in context, as one input among several, it helps diagnose campaigns and guide early-stage decisions. Used as a primary KPI, it systematically misleads and drives the wrong optimization behavior.
Cost Per Customer is the metric that connects marketing spend to business outcomes. It accounts for lead quality, funnel efficiency, and sales conversion in a single number. It is directly comparable to LTV, which means it produces actionable, financially grounded decisions.
The businesses winning in paid advertising are not the ones with the cheapest leads. They are the ones who know exactly how much it costs to acquire a profitable customer, what is driving that number up or down, and how to move it in the right direction.
That is the level of clarity that turns marketing from a cost center into a growth engine.
Frequently Asked Questions
What is the difference between Cost Per Lead and Cost Per Customer?
Cost Per Lead (CPL) is the amount you spend to generate a single lead, meaning someone who has expressed interest in your product or service. Cost Per Customer, also called Customer Acquisition Cost (CAC), is the total amount you spend to acquire one paying customer. CAC accounts for the fact that not every lead becomes a customer, making it a far more accurate measure of marketing efficiency and business profitability.
How do you calculate Cost Per Customer from Cost Per Lead?
The formula is: CAC = CPL divided by Lead-to-Customer Conversion Rate. For example, if your CPL is $50 and 10% of your leads become customers, your CAC is $500. The conversion rate is the critical variable that CPL-only reporting ignores entirely.
Why is Cost Per Lead a misleading metric?
CPL is misleading because it measures input activity, not output results. A campaign can generate thousands of cheap leads that never convert, resulting in high acquisition costs and low revenue. CPL also varies dramatically by lead source, intent level, and audience quality, meaning a $10 lead from a broad awareness campaign is not comparable to a $100 lead from a high-intent search campaign.
What is a good Cost Per Customer?
A healthy CAC depends on your average customer lifetime value (LTV). The standard benchmark is an LTV:CAC ratio of at least 3:1, meaning every customer should generate at least three times what it cost to acquire them. For subscription businesses, payback period matters too; ideally you recover CAC within 12 months.
When should I optimize CPL vs CAC?
Optimize CPL when you are in early-stage testing and need to establish baseline efficiency across channels. Shift focus to CAC once campaigns are running and you have enough conversion data. Never use CPL as your primary success metric when making budget allocation decisions.
Can a low CPL indicate poor lead quality?
Yes, frequently. Campaigns optimized purely for lead volume often attract low-intent prospects who never buy. This is one of the most common causes of high CAC despite seemingly strong CPL performance.
Leave a Reply