Your ads aren’t the problem — your funnel is. Learn why strong CPL numbers can coexist with terrible revenue results, and how to diagnose and fix the exact stage that’s killing your paid acquisition.
TLDR:
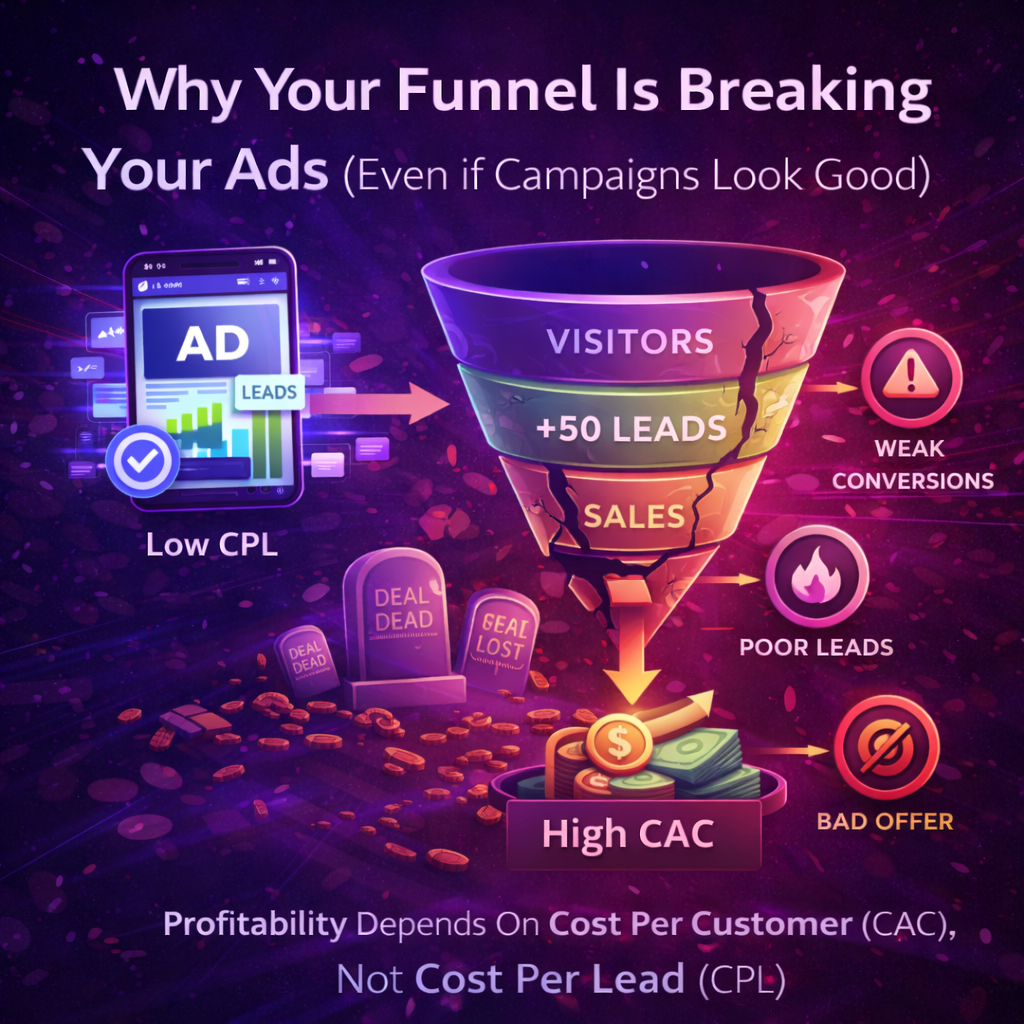
A low cost per lead does not mean your paid ads are working. If your funnel has weak conversion rates, poor lead quality, or a misaligned offer, you can spend efficiently and still lose money. The real number that determines profitability is cost per customer (CAC), not CPL. To fix a broken funnel, you need to identify which stage is leaking, then make structural changes to your offer, landing page, follow-up sequence, or sales process. Optimizing ad creative when the funnel is broken is the most common and most expensive mistake in paid acquisition.
Here is a scenario that plays out inside businesses every week: the ad account looks healthy. CPL is down. Volume is up. The agency sends a report with green arrows. And yet revenue has not moved.
This is not an ads problem. This is a funnel problem wearing the mask of an ads problem. And until you learn to tell the difference, you will keep optimizing the wrong thing while the real issue quietly drains your budget.
The CPL Trap: Why Your Most-Watched Metric Is Often the Most Misleading
Cost per lead is the metric most business owners and marketing managers track obsessively because it is easy to pull, easy to present, and feels like a direct signal of how campaigns are performing.
The formula is simple:
CPL = Ad Spend / Number of Leads Generated
Spend $5,000, get 200 leads, your CPL is $25. Clean. Reportable. Shareable in a slide deck.
But here is what CPL does not tell you:
- How many of those 200 leads are qualified buyers
- What percentage converted into paying customers
- What the actual revenue generated was
- Whether the economics of your acquisition are sustainable
A $25 CPL sounds like a win. But if only 1% of those leads convert into customers and your product costs $500, you have spent $2,500 to generate $1,000 in revenue. The CPL looked great. The business lost money.
This is the CPL trap, and it catches even experienced marketers.
Cost Per Lead vs. Cost Per Customer: The Distinction That Changes Everything
These two metrics measure fundamentally different things, and confusing them is one of the most expensive mistakes a business can make in paid acquisition.
Cost Per Lead (CPL) measures the efficiency of your advertising at generating interest. It tells you how well your targeting, creative, and offer are at getting people to raise their hand.
Cost Per Acquisition or Customer (CAC) measures the efficiency of your entire system at generating revenue. It tells you how much your business actually spends to convert a stranger into a paying customer.
The relationship between them is defined by one variable: your funnel conversion rate.
CAC = CPL / Funnel Conversion Rate
If your CPL is $30 and your funnel converts leads to customers at 10%, your CAC is $300.
If your CPL is $30 and your funnel converts at 2%, your CAC is $1,500.
The ad spend is identical in both cases. The CPL is identical. But one scenario is likely profitable and the other is almost certainly not. The difference is entirely in the funnel.
This is why CAC is the metric that actually tells you whether your paid acquisition is working, and CPL is just one input into that calculation.
Why Funnels Break Without Anyone Noticing
The reason so many businesses run into this problem is that funnel failure is not always dramatic. Ads keep running. Leads keep coming in. Reports keep getting sent. Nothing looks obviously broken from the outside.
What is actually happening is a slow bleed across multiple stages, each one losing a percentage of the potential customers you paid to attract.
A typical paid acquisition funnel looks like this:
- Ad impression
- Click
- Landing page visit
- Lead form submission or opt-in (CPL is measured here)
- Lead engagement: email open, call booked, link clicked
- Qualification or sales call
- Close
Every one of those stages has a conversion rate. A mediocre rate at any single stage compounds with mediocre rates at every other stage. The result is a funnel that looks functional but performs poorly in terms of actual revenue.
Here is a concrete example:
Say you send 1,000 clicks to a landing page at $3 per click ($3,000 total). Your landing page converts at 15%, giving you 150 leads at a $20 CPL. Of those 150, only 40% engage enough to book a call (60 booked). Of those 60, only 50% show up (30 showed). Of those 30, your sales team closes 30% (9 customers).
You spent $3,000 and got 9 customers. CAC is $333.
Now change one thing: your landing page converts at 8% instead of 15%, which is a single-stage failure that many businesses never even audit. Everything else stays the same. You get 80 leads, 32 book, 16 show, 5 customers close.
You spent the same $3,000 and got 5 customers. CAC jumps to $600. Not because the ads changed. Not because the offer changed. Because one page underperformed by 7 percentage points.
This is how funnels break quietly, and why a strong CPL can coexist with a business that is barely breaking even on ad spend.
The Four Most Common Funnel Failure Points
Understanding where funnels break is the first step to fixing them. In high-volume paid acquisition, the failures cluster around four predictable areas.
1. The Landing Page Is Not Matching the Ad’s Promise
This is the most common failure and the most underdiagnosed. When someone clicks your ad, they arrive with a specific expectation based on the headline, creative, and copy they just saw. If the landing page does not immediately confirm and extend that expectation, they leave.
This is called message mismatch, and it silently destroys conversion rates. You can have a great ad and a decent landing page that perform terribly together because the transition feels discontinuous.
If your ad promises “get 10 new clients in 30 days,” your landing page headline should not say “Welcome to Our Marketing Agency.” It should say something that directly continues the conversation the ad started.
The fix is ruthless message continuity from ad to page.
2. The Offer Attracts Curiosity, Not Commitment
A free ebook, a generic consultation, or a low-threshold lead magnet will reliably produce a low CPL. It will also reliably produce a low-quality lead pool.
When your offer requires almost nothing from the prospect, the people who respond are often early-stage researchers, tire-kickers, and people who have no real buying intent. They entered your funnel because the friction was low, not because they have a problem you can solve.
In high-ticket service businesses and B2B companies, the quality of the lead matters far more than the volume. A $15 CPL with a 1% close rate is economically worse than a $60 CPL with a 10% close rate.
The fix is often to raise the commitment threshold of the offer: require a brief application, ask qualifying questions in the form, or position the offer in a way that filters out browsers and attracts buyers.
3. The Follow-Up System Is Letting Leads Go Cold
Most leads do not convert on first contact. In B2B and high-ticket markets, the average buying decision involves multiple touchpoints over days or weeks. If your follow-up system consists of a single automated email and a sales rep who calls once, you are leaving the majority of your potential revenue on the table.
Speed is also critical. Studies consistently show that response times under five minutes dramatically increase lead conversion rates compared to follow-up that happens hours later. By the time many businesses respond to a new lead, that person has already spoken to a competitor.
The fix is a structured follow-up sequence: immediate automated acknowledgment, personal outreach within minutes where possible, and a multi-touch cadence that keeps qualified leads moving forward rather than letting them go cold.
4. The Sales Process Has No Diagnostic Framework
Generating qualified leads means nothing if the sales conversation is unstructured. A sales process that lacks a clear discovery framework, fails to surface the prospect’s real pain, or rushes to pitch before establishing trust will produce low close rates regardless of lead quality.
This is especially common in businesses where the founder or a non-sales specialist handles calls. The knowledge is there but the framework is not, and without a framework, close rates are inconsistent and hard to improve.
The fix is a documented sales process with a clear structure: rapport building, discovery questions, problem articulation, solution presentation tied to specific outcomes, and a clear next step at the end of every call.
When CPL Is Useful and When It Is Actively Dangerous
CPL is not a useless metric. Used correctly, it is a valuable signal. Used in isolation, it is actively misleading.
CPL is useful when:
- You are comparing campaigns against each other within the same funnel, where conversion rates are held constant
- You are testing ad creative, headlines, or audiences and want a fast feedback signal
- You have a proven, high-converting funnel and you are optimizing for volume
- You understand your downstream conversion rates and can model CAC from CPL accurately
CPL is dangerous when:
- You treat it as the primary success metric without knowing your close rate or average deal value
- You optimize for it by lowering offer thresholds, which improves CPL while degrading lead quality
- You use it to evaluate whether an entire channel is working without auditing what happens after the lead comes in
- You present it to stakeholders as evidence that campaigns are performing when revenue data tells a different story
The clearest signal of a business falling into the CPL trap is when marketing reports focus heavily on leads generated and cost per lead while revenue-per-lead and customer acquisition cost are either not tracked or not discussed.
The Diagnostic Framework: How to Find Where Your Funnel Is Breaking
Before you change a single ad or adjust a single audience, run this audit on your funnel. It will tell you exactly where to focus.
Step 1: Map every stage of your funnel and assign a conversion rate to each.
If you do not have data for a stage, that is itself a signal. Start tracking immediately.
Step 2: Compare your rates against realistic benchmarks for your market.
Typical landing page conversion rates for paid traffic run between 10% and 25% depending on the offer and industry. Lead-to-booked call rates for high-ticket services typically run between 20% and 40%. Show rates on booked calls typically run between 50% and 80%. Close rates on qualified calls in high-ticket B2B typically run between 15% and 35%.
Step 3: Identify the stage with the largest gap between your rate and the benchmark.
That is your primary leak. Fix that before anything else.
Step 4: Model what fixing that single stage does to your CAC.
Often, improving a single stage by 5 to 10 percentage points cuts CAC by 30% or more. This is the highest-leverage work in paid acquisition, and it has nothing to do with the ad account.
Step 5: Run the math forward before making changes.
If you improve your landing page conversion from 8% to 14%, model what that does to your lead volume, your booked calls, your close volume, and your CAC at current spend levels. This turns optimization from guesswork into a planned sequence of improvements.
Real-World Scenario: Good CPL, Bad Business Outcome
A home services company runs Google Ads targeting renovation keywords. Their average job value is $8,000 and they are spending $6,000 per month on ads.
The campaign generates 120 leads per month at a $50 CPL. The marketing report shows a strong result.
But when you trace those 120 leads through the funnel, the picture changes:
- 120 leads come in
- 60 are reachable and qualify for a callback (50% contact rate)
- 25 agree to an in-home estimate (42% appointment rate)
- 18 show for the appointment (72% show rate)
- 6 book a job (33% close rate on appointments)
Six customers from $6,000 in ad spend. CAC is $1,000 on an $8,000 job. That is a 12.5% customer acquisition cost, which is acceptable in home services but leaves almost no room for error.
Now imagine the contact rate drops to 30% because the CRM follow-up is slow. The cascade is immediate: 36 contacted, 15 estimates, 11 show, 4 close. CAC jumps to $1,500 without a single change in the ad account.
The CPL never changed. The problem was entirely in the follow-up system. But if the business owner is only watching CPL, they will ask the agency to fix the ads while the real issue goes unaddressed.
What to Actually Optimize: A Practical Prioritization Guide
Once you have identified your funnel’s weakest stage, here is how to approach the fix based on where the leak is occurring.
If the issue is landing page conversion rate: Test a new headline that matches the ad message more precisely. Remove friction from the form. Add a specific, outcome-oriented value proposition above the fold. Reduce the number of fields to the minimum needed. Add social proof in the form of client results, not generic testimonials.
If the issue is lead quality: Raise the commitment threshold of your offer. Add qualifying questions to your form. Adjust targeting to match your actual buyer profile more precisely. Consider whether your ad creative is attracting the right intent signal.
If the issue is lead response and follow-up: Build a multi-touch follow-up sequence. Automate the first contact to happen within minutes of the lead coming in. Create a cadence of at least five to seven touchpoints before considering a lead cold. Invest in CRM infrastructure that prevents leads from slipping through without follow-up.
If the issue is close rate: Document your best sales conversations and identify the structure that precedes a closed deal. Implement a discovery framework that surfaces the prospect’s real problem before you pitch anything. Practice handling the three or four most common objections your team faces. Track close rate by sales rep and identify where the gap is largest.
The Most Common Mistakes Business Owners Make With Paid Ads
These patterns appear repeatedly across industries and ad budgets, and each one is rooted in the same fundamental error: treating ads as isolated from the funnel they are feeding.
Mistake 1: Blaming the channel before auditing the funnel. When revenue does not follow lead volume, the instinct is to blame the platform or the agency. In most cases, the channel is working. The system receiving the leads is not.
Mistake 2: Scaling ad spend before fixing conversion rates. Spending more on a broken funnel generates more wasted budget, not more customers. Fix the conversion rates first. Scale spend second. This sequence is not optional.
Mistake 3: Measuring success by lead volume instead of revenue per lead. Volume without downstream tracking is vanity. Every business running paid ads should know their revenue per lead: total revenue from paid leads divided by total leads. This single number summarizes funnel health better than any individual metric.
Mistake 4: Changing ads constantly while leaving the funnel untouched. Creative fatigue is real, but it is rarely the primary driver of declining performance. Yet most businesses respond to performance drops by refreshing ads first, when the landing page has not been meaningfully updated in months and the follow-up sequence has never been tested.
Mistake 5: Not connecting ad data to sales data. Without a closed-loop reporting system that ties ad spend to actual revenue, you cannot know which campaigns are generating profit. Agencies that work inside a sophisticated reporting framework, where ad data connects directly to CRM and revenue data, are able to make decisions that agencies operating in data silos simply cannot.
The Strategic Framework: How to Think About Paid Acquisition as a System
The businesses that get the best returns from paid advertising are not the ones with the best ads. They are the ones with the best systems.
A paid acquisition system has three interconnected components:
Traffic: The ads, targeting, creative, and bidding strategy that bring qualified prospects to your funnel. This is what most people focus on.
Conversion: The landing pages, offers, forms, follow-up sequences, and sales processes that turn those prospects into customers. This is where most leverage lives.
Economics: The pricing, LTV, margins, and repeat purchase rates that determine whether the unit economics of acquisition are sustainable. This is what determines whether a given CAC is acceptable.
When you optimize only at the traffic layer, you are competing for marginal improvements in CPL while leaving the highest-leverage opportunities untouched. A 10% improvement in your landing page conversion rate, your show rate, or your close rate has a far greater impact on CAC than a 10% improvement in CPL.
This systems-level thinking is what separates transactional marketing execution from genuine paid acquisition strategy.
Agencies operating at this level, like S2 Ads Agency, build their engagements around the full acquisition system rather than just the ad account. The work includes auditing the funnel before scaling spend, identifying conversion leverage points before creative optimization, and tying every campaign decision back to the economics of customer acquisition. Engagements start from $1,500 per month for early-stage companies and scale with the scope of the system being managed.
What You Should Do This Week
You do not need to rebuild your entire funnel to start making progress. You need to diagnose accurately and fix sequentially.
Start here:
- Pull your landing page conversion rate from your analytics platform. If it is below 10% for paid traffic, that is your first priority.
- Check your lead response time. If your first contact with a new lead is more than 30 minutes after submission, build an immediate automated response today.
- Calculate your actual CAC for the last 90 days. Divide your total paid ad spend by the number of customers it generated. If you do not know this number, that is the most urgent problem to solve.
- Map your funnel stage by stage and assign a rate to each one. Find the lowest rate relative to benchmark. That is your highest-leverage optimization target.
If your CPL looks healthy and revenue is still not where it should be, the answer is not better ads. The answer is a better system.
The campaigns are telling you what you want to hear. The funnel is telling you the truth. Listen to the funnel.
FAQ
What does it mean when my ads have a good CPL but low revenue?
It means your funnel is converting traffic into leads efficiently, but something downstream is preventing those leads from becoming paying customers. The issue is rarely the ad itself. It is usually the offer, the landing page experience, the quality of leads being attracted, or a breakdown in the sales process.
What is the difference between cost per lead (CPL) and cost per customer (CAC)?
Cost per lead (CPL) measures how much you pay for each person who expresses interest or enters your funnel. Cost per customer (CAC) measures how much you spend to acquire someone who actually pays you. CPL reflects ad performance. CAC reflects business performance.
Can a low CPL actually be a bad sign?
Yes. A low CPL can indicate that your targeting is too broad and you are attracting people who are curious but not serious buyers. In high-ticket and B2B markets, optimizing purely for cheap leads almost always sacrifices lead quality, which tanks close rates and drives up the real cost of acquiring a customer.
What is a good CAC for a business running paid ads?
It depends entirely on your customer lifetime value (LTV). The standard benchmark is an LTV-to-CAC ratio of at least 3:1. If your average customer is worth $3,000, a CAC under $1,000 is sustainable. If your CAC exceeds your LTV, no amount of ad optimization will save the business.
How do I know if my funnel or my ads are the problem?
Start with CPL and click-through rate benchmarks. If those are within normal range for your industry, the ads are functioning. Then audit your landing page conversion rate, lead-to-appointment rate, show rate, and close rate in sequence. The stage where the rate drops sharply is your leak.
Leave a Reply